Linear Transformations
Theory
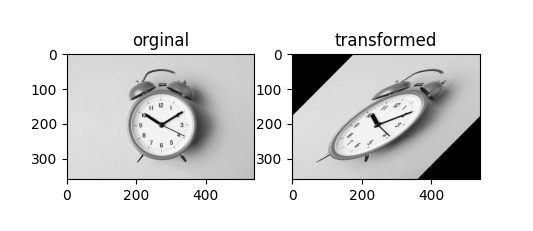
Linear transformations are used to geometrically manipulate images by mapping pixel coordinates using linear equations. They preserve straight lines and parallelism while changing positions, orientations, or scales of objects in the image.
1. Types of Linear Transformations
- Translation: Moves the image horizontally or vertically.
- Scaling: Enlarges or shrinks the image.
- Rotation: Rotates the image by a specified angle around a point.
- Shearing: Slants the shape of an image along a specific axis.
2. Transformation Matrix
Linear transformations can be represented using a 2×2 transformation matrix. For a pixel coordinate
(x, y), the transformed coordinate (x', y') is calculated as:
x' = a*x + b*y
y' = c*x + d*y
Here, a, b, c, d are matrix elements defining the type of transformation (rotation, scaling, shearing, etc.).
3. Applications
- Image alignment and registration
- Geometric corrections in satellite images
- Object rotation or resizing in computer vision
- Preprocessing images for deep learning models
Python Code
import cv2
import numpy as np
import matplotlib.pyplot as plt

# Load the image
img = cv2.imread('assets/low_c.jpeg', cv2.IMREAD_COLOR)
rows, cols, _ = img.shape

# Define a custom transformation matrix (example: shearing + rotation)
rotation_matrix = np.array([
    [1, -1],
    [0,  1]
])

# Create a grid of pixel coordinates
x, y = np.meshgrid(np.arange(cols), np.arange(rows))
coords = np.stack([x.ravel(), y.ravel()], axis=1)

# Center coordinates
center = np.array([cols / 2, rows / 2])
coords_centered = coords - center

# Apply linear transformation
transformed_coords = np.dot(coords_centered, rotation_matrix.T) + center

# Keep only valid coordinates
transformed_coords = np.round(transformed_coords).astype(int)
mask = (
    (transformed_coords[:, 0] >= 0) & (transformed_coords[:, 0] < cols) &
    (transformed_coords[:, 1] >= 0) & (transformed_coords[:, 1] < rows)
)
valid_coords = transformed_coords[mask]
original_coords = coords[mask]

# Create transformed image
transformed_img = np.zeros_like(img)
transformed_img[valid_coords[:, 1], valid_coords[:, 0]] = img[original_coords[:, 1], original_coords[:, 0]]

# Display results
plt.subplot(1, 2, 1)
plt.imshow(cv2.cvtColor(img, cv2.COLOR_BGR2RGB))
plt.title("Original")

plt.subplot(1, 2, 2)
plt.imshow(cv2.cvtColor(transformed_img, cv2.COLOR_BGR2RGB))
plt.title("Transformed")

plt.show()
Example Output