Contrast Stretching
Theory
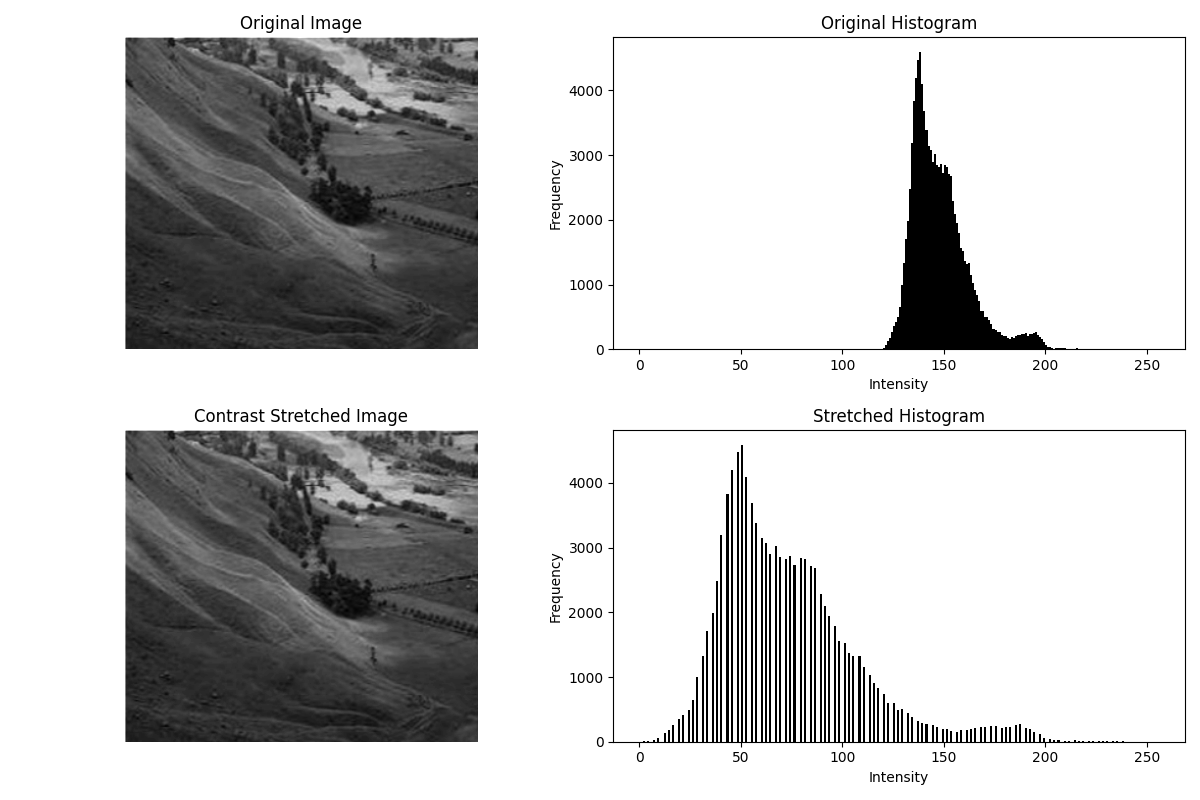
Contrast stretching is an image enhancement technique used to improve the visibility of features by expanding the range of intensity levels. Images with low contrast (pixel values clustered within a narrow range) often appear dull or washed out, and contrast stretching redistributes the intensities to utilize the full dynamic range.
1. How it Works
The original pixel intensity values, denoted by r, are mapped from an input range [r_min, r_max] to an output range [s_min, s_max] (usually 0–255).
The transformation formula is:
s = (r - r_min) / (r_max - r_min) * (s_max - s_min) + s_min2. Applications
- Enhancing low-contrast images in medical imaging (X-rays, MRI scans).
- Improving satellite and aerial imagery for better feature detection.
- Preparing images for computer vision tasks like segmentation and object recognition.
- General photography enhancement to make images visually appealing.
By stretching pixel intensities across the available range, subtle details in shadows and highlights become more pronounced, making the image more informative.
Python Code
import cv2
import numpy as np
import matplotlib.pyplot as plt

def contrast_stretching(img, s_min=0, s_max=255):
    """
    Perform contrast stretching on a grayscale image.
    """
    r_min, r_max = np.min(img), np.max(img)
    stretched = (img - r_min) / (r_max - r_min) * (s_max - s_min) + s_min
    return np.uint8(stretched)

# Load grayscale image
img = cv2.imread('assets/asd.jpeg', cv2.IMREAD_GRAYSCALE)
assert img is not None, "Image not found!"

# Apply contrast stretching
stretched_img = contrast_stretching(img)

# Plot images and histograms
plt.figure(figsize=(12, 8))

# Original Image and Histogram
plt.subplot(2, 2, 1)
plt.imshow(img, cmap='gray')
plt.title("Original Image")
plt.axis('off')

plt.subplot(2, 2, 2)
plt.hist(img.ravel(), bins=256, range=(0, 256), color='black')
plt.title("Original Histogram")
plt.xlabel("Intensity")
plt.ylabel("Frequency")

# Stretched Image and Histogram
plt.subplot(2, 2, 3)
plt.imshow(stretched_img, cmap='gray')
plt.title("Contrast Stretched Image")
plt.axis('off')

plt.subplot(2, 2, 4)
plt.hist(stretched_img.ravel(), bins=256, range=(0, 256), color='black')
plt.title("Stretched Histogram")
plt.xlabel("Intensity")
plt.ylabel("Frequency")

plt.tight_layout()
plt.show()
Example Output