Intensity-Level Slicing
Theory
Intensity-level slicing is an image enhancement technique used to highlight specific ranges of pixel intensities. It is particularly effective in applications where certain intensity ranges correspond to important features, such as medical imaging (e.g., X-rays), satellite imagery, and remote sensing.
1. Methods of Intensity Slicing
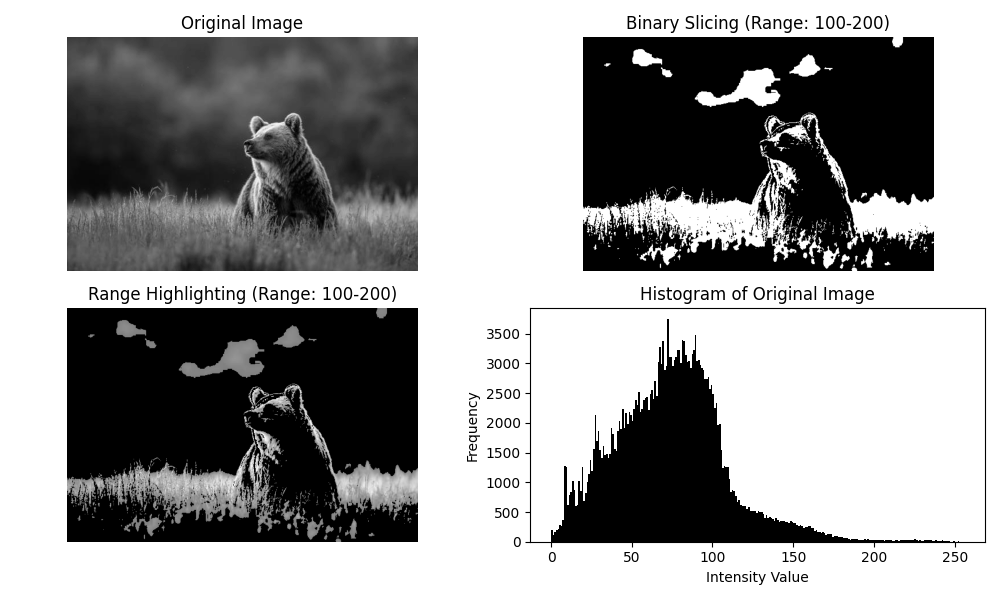
- Binary Slicing: Pixels within the specified intensity range are set to a high value (e.g., white), while all other pixels are set to a low value (e.g., black). This clearly highlights the regions of interest.
- Range Highlighting: Pixels within the range retain their original intensity values, and pixels outside the range are suppressed to a low value. This method preserves some detail while emphasizing the selected range.
2. Applications
- Enhancing specific features in satellite imagery (e.g., water bodies, vegetation).
- Highlighting abnormalities in medical images (e.g., tumors, lesions).
- Preprocessing images for segmentation or object detection.
By applying intensity slicing, important regions in an image become more visible and easier to analyze.
Python Code
import cv2
import numpy as np
import matplotlib.pyplot as plt

def intensity_slicing(img, r_min, r_max, high_value=255, low_value=0, binary=True):
    """
    Apply intensity-level slicing to an image.
    """
    sliced_img = np.zeros_like(img, dtype=np.uint8)

    if binary:
        # Binary Slicing
        sliced_img[(img >= r_min) & (img <= r_max)] = high_value
    else:
        # Range Highlighting
        sliced_img = np.copy(img)
        sliced_img[(img < r_min) | (img > r_max)] = low_value

    return sliced_img

# Load grayscale image
img = cv2.imread('assets/bear.jpg', cv2.IMREAD_GRAYSCALE)

# Apply intensity-level slicing
r_min, r_max = 100, 200
binary_sliced = intensity_slicing(img, r_min, r_max, binary=True)
highlighted = intensity_slicing(img, r_min, r_max, binary=False)

# Display results
plt.figure(figsize=(10, 6))

plt.subplot(2, 2, 1)
plt.imshow(img, cmap='gray')
plt.title("Original Image")
plt.axis('off')

plt.subplot(2, 2, 2)
plt.imshow(binary_sliced, cmap='gray')
plt.title(f"Binary Slicing ({r_min}-{r_max})")
plt.axis('off')

plt.subplot(2, 2, 3)
plt.imshow(highlighted, cmap='gray')
plt.title(f"Range Highlighting ({r_min}-{r_max})")
plt.axis('off')

plt.subplot(2, 2, 4)
plt.hist(img.ravel(), bins=256, range=(0, 256), color='black')
plt.title("Histogram of Original Image")
plt.xlabel("Intensity Value")
plt.ylabel("Frequency")

plt.tight_layout()
plt.show()
Example Output