Otsu Thresholding
Theory
Otsu’s method is an automatic global thresholding technique that selects the optimal threshold by maximizing the separation between two classes of pixels (foreground and background). It is widely used in image segmentation, especially for bimodal histograms.
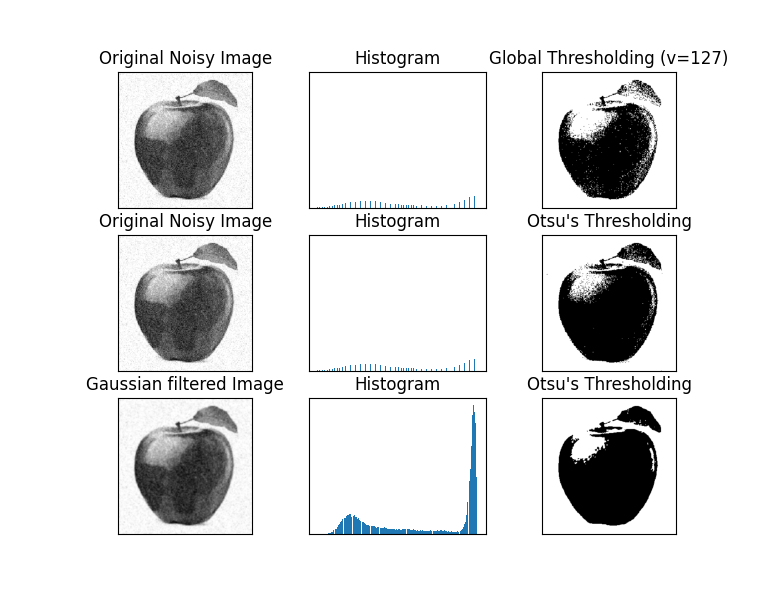
- Global Thresholding: A fixed threshold is applied across the entire image. Simple but may fail if image lighting varies.
- Otsu’s Thresholding: Automatically computes the threshold by minimizing the intra-class variance (variance within foreground and background pixels).
- Gaussian Pre-filtering + Otsu: Applying a Gaussian blur before Otsu thresholding reduces noise, giving a cleaner separation of object and background.
- Applications: Document scanning, medical imaging, object detection, and preprocessing for morphological operations.
The key advantage of Otsu’s method is that it adapts to the image’s histogram automatically, removing the need for manual threshold selection.
Python Code
import cv2 as cv
import numpy as np
from matplotlib import pyplot as plt

# Load grayscale image
img = cv.imread('assets/noisy3.png', cv.IMREAD_GRAYSCALE)
assert img is not None, "file could not be read"

# Global thresholding
ret1, th1 = cv.threshold(img, 127, 255, cv.THRESH_BINARY)

# Otsu's thresholding
ret2, th2 = cv.threshold(img, 0, 255, cv.THRESH_BINARY + cv.THRESH_OTSU)

# Otsu's thresholding after Gaussian filtering
blur = cv.GaussianBlur(img, (5,5), 0)
ret3, th3 = cv.threshold(blur, 0, 255, cv.THRESH_BINARY + cv.THRESH_OTSU)

# Plot results
images = [img, 0, th1,
          img, 0, th2,
          blur, 0, th3]
titles = ['Original Noisy Image','Histogram','Global Thresholding (v=127)',
          'Original Noisy Image','Histogram',"Otsu's Thresholding",
          'Gaussian Filtered Image','Histogram',"Otsu's Thresholding"]

for i in range(3):
    plt.subplot(3, 3, i*3+1), plt.imshow(images[i*3], 'gray')
    plt.title(titles[i*3]), plt.xticks([]), plt.yticks([])
    plt.subplot(3, 3, i*3+2), plt.hist(images[i*3].ravel(), 256)
    plt.title(titles[i*3+1]), plt.xticks([]), plt.yticks([])
    plt.subplot(3, 3, i*3+3), plt.imshow(images[i*3+2], 'gray')
    plt.title(titles[i*3+2]), plt.xticks([]), plt.yticks([])

plt.tight_layout()
plt.show()
Output