Double Thresholding
Theory
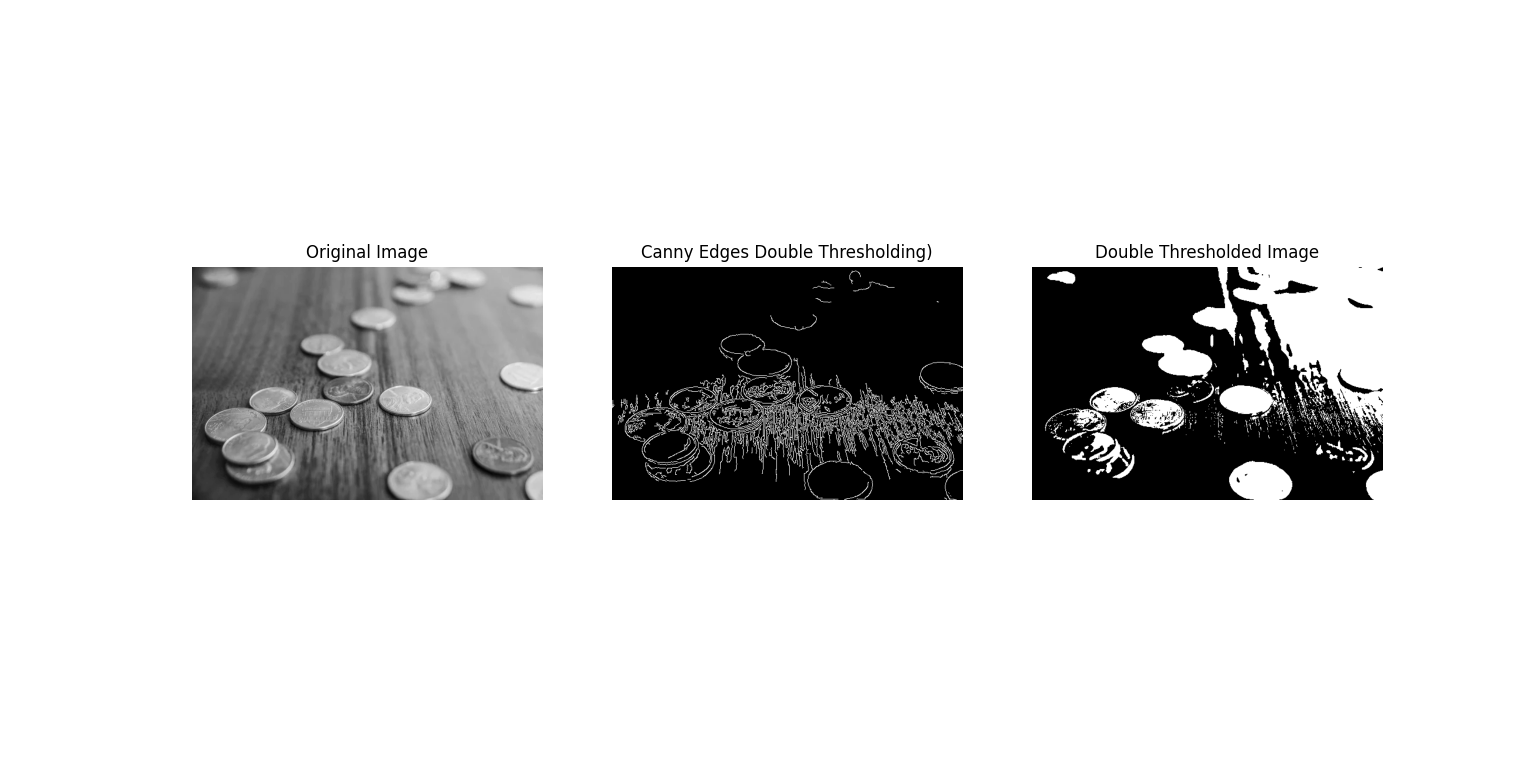
Double thresholding is a segmentation technique that uses two distinct intensity thresholds to classify pixels. It is widely applied in edge detection (such as in the Canny edge detector) and image segmentation.
- Lower Threshold: Pixels with intensity below this value are considered background and set to zero.
- Upper Threshold: Pixels above this value are considered strong features and set to the maximum value (usually 255).
- Intermediate Pixels: Pixels with intensity between the lower and upper thresholds are classified as weak. These pixels are often preserved only if they are connected to strong pixels (edge linking).
The double thresholding approach improves robustness by reducing noise sensitivity and ensuring that only significant features are detected while weak features connected to strong ones are retained.
Python Code
import cv2
import numpy as np
import matplotlib.pyplot as plt

# Custom double threshold function
def double_threshold(image, lower_thresh, upper_thresh):
    lower_thresholded = np.where(image >= lower_thresh, image, 0)
    higher_thresholded = np.where(lower_thresholded >= upper_thresh, 255, 0)
    return higher_thresholded.astype(np.uint8)

# Load grayscale image
img = cv2.imread('assets/coins.jpg', cv2.IMREAD_GRAYSCALE)

# Apply Canny edge detection (built-in double thresholding)
lower_threshold = 50
upper_threshold = 150
edges = cv2.Canny(img, lower_threshold, upper_threshold)

# Apply custom double thresholding
result = double_threshold(img, lower_threshold, upper_threshold)

# Display results
plt.figure(figsize=(12, 6))
plt.subplot(1, 3, 1)
plt.imshow(img, cmap='gray')
plt.title('Original Image')
plt.axis('off')

plt.subplot(1, 3, 2)
plt.imshow(edges, cmap='gray')
plt.title('Canny Edges (Double Threshold)')
plt.axis('off')

plt.subplot(1, 3, 3)
plt.imshow(result, cmap='gray')
plt.title('Double Thresholded Image')
plt.axis('off')

plt.tight_layout()
plt.show()
Output