Adaptive Thresholding
Theory
Adaptive thresholding is used when an image has uneven illumination, shadows, or gradients. Unlike global thresholding, which uses a single threshold value for the entire image, adaptive thresholding computes a threshold for smaller regions (blocks or neighborhoods) of the image. This allows for accurate segmentation of regions even under varying lighting conditions.
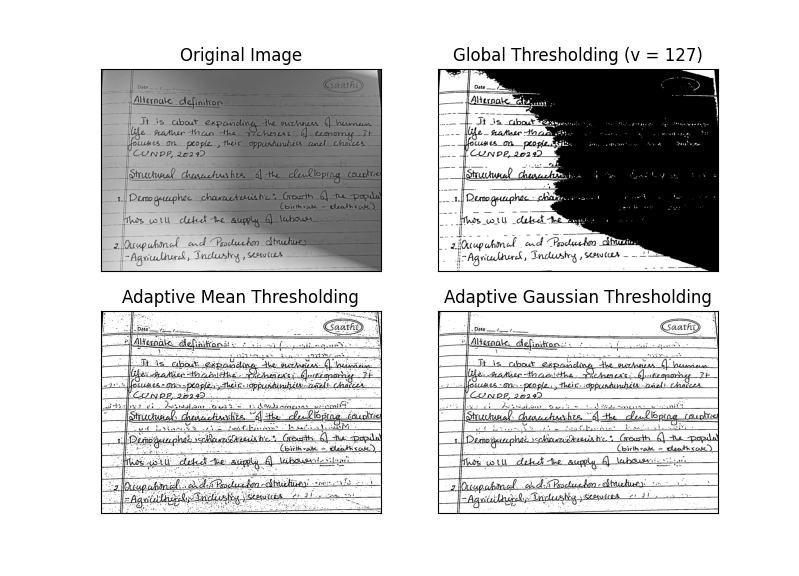
- Global Thresholding: Applies a fixed threshold across the entire image. Simple but ineffective for images with varying lighting.
- Adaptive Mean Thresholding: Calculates the threshold for each local neighborhood as the mean of the pixel values minus a constant.
- Adaptive Gaussian Thresholding: Calculates the threshold for each neighborhood as a weighted sum of pixel values (Gaussian weighting) minus a constant. This gives smoother results compared to mean thresholding.
- Block Size: Determines the size of the neighborhood to calculate the threshold. Typical values are odd numbers like 3, 5, 11, etc.
- Applications: Document scanning, OCR preprocessing, detecting text in unevenly illuminated images, and general segmentation tasks.
Python Code
import cv2 as cv
import numpy as np
import matplotlib.pyplot as plt

# Load grayscale image
img = cv.imread('assets/page.jpeg', cv.IMREAD_GRAYSCALE)
assert img is not None, "file could not be read"

# Apply median blur to reduce noise
img = cv.medianBlur(img, 5)

# Global thresholding
ret, th1 = cv.threshold(img, 127, 255, cv.THRESH_BINARY)

# Adaptive Mean Thresholding
th2 = cv.adaptiveThreshold(img, 255, cv.ADAPTIVE_THRESH_MEAN_C,
                           cv.THRESH_BINARY, 11, 2)

# Adaptive Gaussian Thresholding
th3 = cv.adaptiveThreshold(img, 255, cv.ADAPTIVE_THRESH_GAUSSIAN_C,
                           cv.THRESH_BINARY, 11, 2)

# Plot results
titles = ['Original Image',
          'Global Thresholding (v=127)',
          'Adaptive Mean Thresholding',
          'Adaptive Gaussian Thresholding']

images = [img, th1, th2, th3]

for i in range(4):
    plt.subplot(2, 2, i+1), plt.imshow(images[i], 'gray')
    plt.title(titles[i])
    plt.xticks([]), plt.yticks([])

plt.tight_layout()
plt.show()
Output